DASHBOARD DESIGNER
Track important KPIs through a series of charts, graphs and data measures
Key Capabilities

Multiple Connections
Connect to Multiple Databases
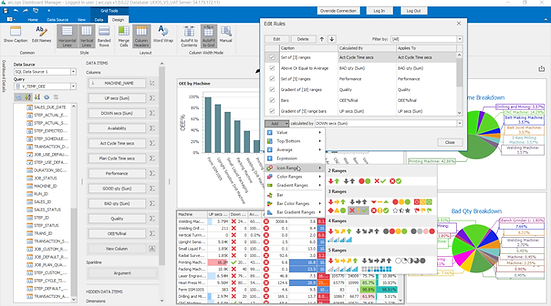
The module can connect to multiple types of SQL databases using the Data Source wizard. Users can also use data access API to connect to the database and select the required data in code.

Configure KPIs

Easily Configure KPIs
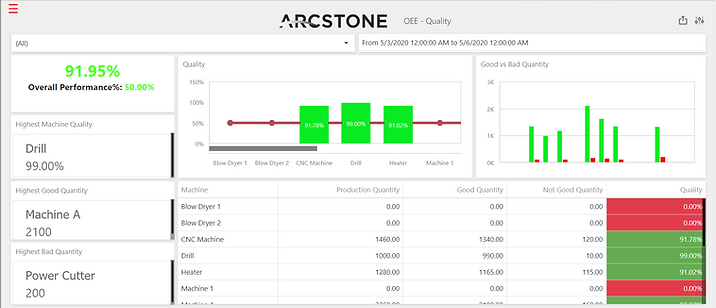
End-users are able to design, configure, and monitor calculations for KPIs such as costing, progress, and OEE.
Quality Management

QA/QC & Statistical Calculations
Rapidly aggregate and manage production quality control efforts using in-built toolsets for running statistical calculations and generation key insights.


Accessible from Tablets & Mobile Device
From rotating dashboards on large screens to easy to use mobile interfaces at users’ fingertips, users can configure a range of dashboard designs for presentation and use in a variety of settings.
Mobile Access
Large Number of Charts, Graphs, Displays & Visuals
Be able to mix and match visual displays and features to design the ideal dashboard for different audiences, from C-suite management to operators on the factory floor.
Custom Views

Track Production

Monitor & Track Production
The Dashboard Designer can be
linked and integrated with
Arcstone toolsets and modules to
monitor production processes and
operations.
So why choose ARCSTONE?
With Arcstone’s solution for Scheduling Optimization, manufacturers can now have complete information of what’s happening on the production floor at their fingertips. With this level of visibility, schedulers can rapidly optimize resource utilization by accurately scheduling orders to unoccupied production lines.